
Page 240 - Excel Progamming Weekend Crash Course
P. 240
n540629 ch17.qxd 9/2/03 9:35 AM Page 215
Session 17 — Introduction to Charts 215
Most chart types come in 2-D and 3-D versions. The constants have the “3D”
characters included. For example, xlArea creates a 2-D area chart, and
Tip xl3DArea creates a 3-D area chart.
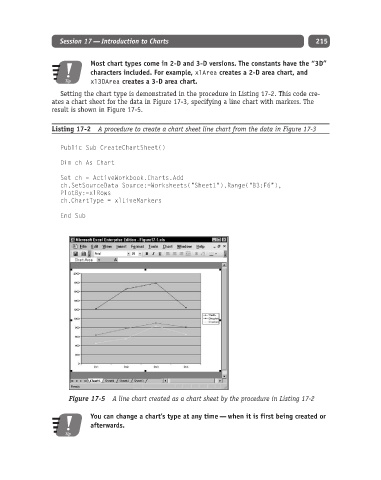
Setting the chart type is demonstrated in the procedure in Listing 17-2. This code cre-
ates a chart sheet for the data in Figure 17-3, specifying a line chart with markers. The
result is shown in Figure 17-5.
Listing 17-2 A procedure to create a chart sheet line chart from the data in Figure 17-3
Public Sub CreateChartSheet()
Dim ch As Chart
Set ch = ActiveWorkbook.Charts.Add
ch.SetSourceData Source:=Worksheets(“Sheet1”).Range(“B3:F6”),
PlotBy:=xlRows
ch.ChartType = xlLineMarkers
End Sub
Figure 17-5 A line chart created as a chart sheet by the procedure in Listing 17-2
You can change a chart’s type at any time — when it is first being created or
afterwards.
Tip