
Page 239 - Excel Progamming Weekend Crash Course
P. 239
n540629 ch17.qxd 9/2/03 9:35 AM Page 214
214 Saturday Evening
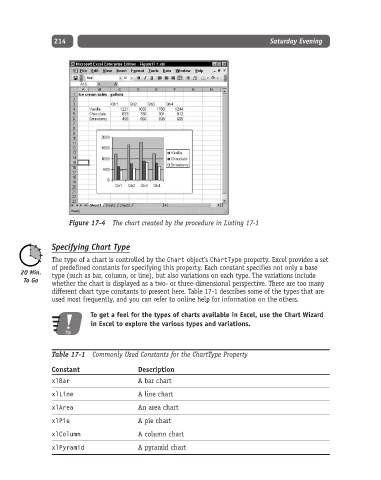
Figure 17-4 The chart created by the procedure in Listing 17-1
Specifying Chart Type
The type of a chart is controlled by the Chart object’s ChartType property. Excel provides a set
of predefined constants for specifying this property. Each constant specifies not only a base
type (such as bar, column, or line), but also variations on each type. The variations include
whether the chart is displayed as a two- or three-dimensional perspective. There are too many
different chart type constants to present here. Table 17-1 describes some of the types that are
used most frequently, and you can refer to online help for information on the others.
To get a feel for the types of charts available in Excel, use the Chart Wizard
in Excel to explore the various types and variations.
Tip
Table 17-1 Commonly Used Constants for the ChartType Property
Constant Description
xlBar A bar chart
xlLine A line chart
xlArea An area chart
xlPie A pie chart
xlColumn A column chart
xlPyramid A pyramid chart