
Page 241 - Excel Progamming Weekend Crash Course
P. 241
n540629 ch17.qxd 9/2/03 9:35 AM Page 216
216 Saturday Evening
Controlling Chart Appearance
Aside from the type of chart, there are many other options for controlling how a chart
looks. Some of these options are for appearance purposes only, while others pertain to
the information the chart conveys to the viewer.
Displaying Chart Titles
Every chart can have a title displayed above the chart. The title is controlled by two proper-
ties of the Chart object:
HasTitle. A True/False value specifying whether the title is displayed.
ChartTitle. A ChartTitle object that controls the details of the title.
To display a title on a chart, you must set the properties of its ChartTitle object and
then set HasTitle to True. The following is an example that displays the title “Annual
Sales” on a chart (assuming that the chart referenced by ch already exists):
ch.HasTitle = True
ch.ChartTitle.Text = “Annual Sales”
You must set HasTitle to True before setting any properties of the
ChartTitle object. If you do not, an error occurs.
Note
Simply setting the text of the chart title, as in this example, results in a title with the
default appearance (font, position, and so on). You can modify the appearance of a chart
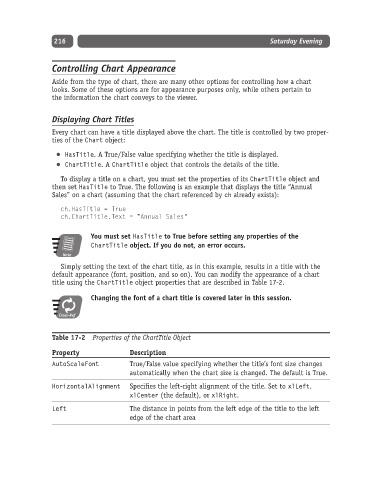
title using the ChartTitle object properties that are described in Table 17-2.
Changing the font of a chart title is covered later in this session.
Cross-Ref
Table 17-2 Properties of the ChartTitle Object
Property Description
AutoScaleFont True/False value specifying whether the title’s font size changes
automatically when the chart size is changed. The default is True.
HorizontalAlignment Specifies the left-right alignment of the title. Set to xlLeft,
xlCenter (the default), or xlRight.
Left The distance in points from the left edge of the title to the left
edge of the chart area