
Page 246 - Excel Progamming Weekend Crash Course
P. 246
n540629 ch17.qxd 9/2/03 9:35 AM Page 221
Session 17 — Introduction to Charts 221
.TickLabels.Font.Name = Arial
.TickLabels.Font.Size = 8
End With
‘ Add a value axis title and set its font.
‘ Also change font of tick labels
With ch.Axes(xlValue)
.HasTitle = True
.AxisTitle.Text = “Sales in Gallons”
.AxisTitle.Font.Name = “Arial”
.AxisTitle.Font.Size = 10
.TickLabels.Font.Name = Arial
.TickLabels.Font.Size = 8
End With
‘ Change the font in the legend.
With ch.Legend.Font
.Name = Arial
.Size = 10
.Color = RGB(255, 0, 0)
End With
End Sub
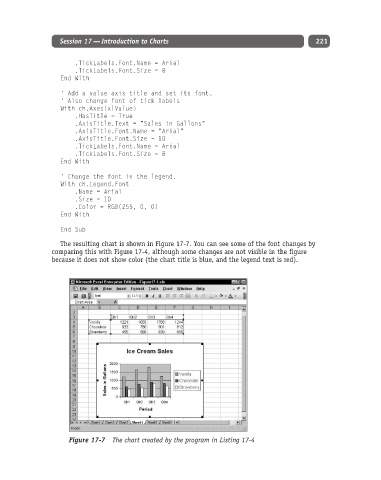
The resulting chart is shown in Figure 17-7. You can see some of the font changes by
comparing this with Figure 17-4, although some changes are not visible in the figure
because it does not show color (the chart title is blue, and the legend text is red).
Figure 17-7 The chart created by the program in Listing 17-4