
Page 244 - Excel Progamming Weekend Crash Course
P. 244
n540629 ch17.qxd 9/2/03 9:35 AM Page 219
Session 17 — Introduction to Charts 219
Working with Fonts in a Chart
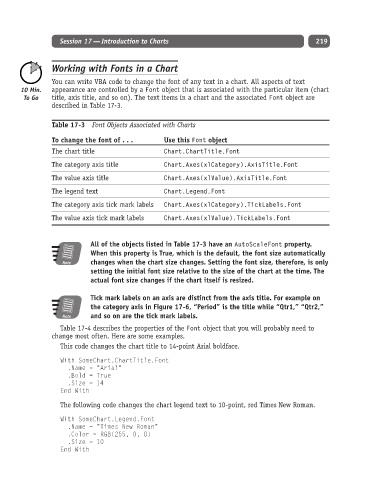
You can write VBA code to change the font of any text in a chart. All aspects of text
appearance are controlled by a Font object that is associated with the particular item (chart
title, axis title, and so on). The text items in a chart and the associated Font object are
described in Table 17-3.
Table 17-3 Font Objects Associated with Charts
To change the font of . . . Use this Font object
The chart title Chart.ChartTitle.Font
The category axis title Chart.Axes(xlCategory).AxisTitle.Font
The value axis title Chart.Axes(xlValue).AxisTitle.Font
The legend text Chart.Legend.Font
The category axis tick mark labels Chart.Axes(xlCategory).TickLabels.Font
The value axis tick mark labels Chart.Axes(xlValue).TickLabels.Font
All of the objects listed in Table 17-3 have an AutoScaleFont property.
When this property is True, which is the default, the font size automatically
Note changes when the chart size changes. Setting the font size, therefore, is only
setting the initial font size relative to the size of the chart at the time. The
actual font size changes if the chart itself is resized.
Tick mark labels on an axis are distinct from the axis title. For example on
the category axis in Figure 17-6, “Period” is the title while “Qtr1,” “Qtr2,”
Note and so on are the tick mark labels.
Table 17-4 describes the properties of the Font object that you will probably need to
change most often. Here are some examples.
This code changes the chart title to 14-point Arial boldface.
With SomeChart.ChartTitle.Font
.Name = “Arial”
.Bold = True
.Size = 14
End With
The following code changes the chart legend text to 10-point, red Times New Roman.
With SomeChart.Legend.Font
.Name = “Times New Roman”
.Color = RGB(255, 0, 0)
.Size = 10
End With