
Page 237 - Excel Progamming Weekend Crash Course
P. 237
n540629 ch17.qxd 9/2/03 9:35 AM Page 212
212 Saturday Evening
The workbook’s Charts collection does not refer to embedded charts — only
to chart sheets. Likewise, a worksheet’s ChartObjects collection refers only
Note to embedded charts and not to chart sheets that may exist in the workbook.
To add a new chart sheet to a workbook, call the Add method:
Charts.Add
This method returns a reference to the new chart. The following code adds a new chart
sheet to the active workbook and obtains a reference to the new chart (which, of course,
is blank):
Dim ch As Chart
Set ch = ActiveWorkbook.Charts.Add
After this code executes, use the variable ch to manipulate the chart.
The Chart Object
The methods you have seen so far for creating a new chart result in a blank chart. The next
step is to define the details of the charts so that it displays the correct data in the desired
manner. At its most basic, there are two parts to this: identifying the data to be plotted,
and specifying the chart type.
Identifying Data to Be Plotted
When identifying the data to be plotted, you need to be aware of how Excel treats data for
charts. The concepts of data series and categories are integral to most Excel chart types.
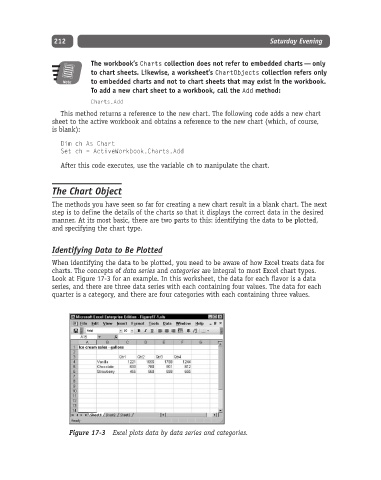
Look at Figure 17-3 for an example. In this worksheet, the data for each flavor is a data
series, and there are three data series with each containing four values. The data for each
quarter is a category, and there are four categories with each containing three values.
Figure 17-3 Excel plots data by data series and categories.