
Page 154 - Excel for Scientists and Engineers: Numerical Methods
P. 154
CHAPTER 7 INTEGRATION 13 1
Calculating the Area under a Curve
Defined by a Formula
Instead of determining the area under a curve defined by a table of data
points, you may need to determine the area under a curve defined by a formula.
For example, you may need to determine the area under the curve defined by
equation 7-6
y=- x3 (7-6)
ex -1
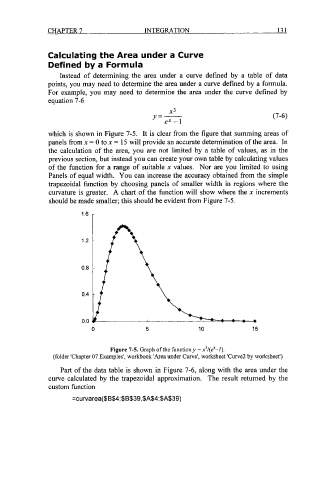
which is shown in Figure 7-5. It is clear from the figure that summing areas of
panels from x = 0 to x = 15 will provide an accurate determination of the area. In
the calculation of the area, you are not limited by a table of values, as in the
previous section, but instead you can create your own table by calculating values
of the function for a range of suitable x values. Nor are you limited to using
Panels of equal width. You can increase the accuracy obtained from the simple
trapezoidal function by choosing panels of smaller width in regions where the
curvature is greater. A chart of the function will show where the x increments
should be made smaller; this should be evident from Figure 7-5.
0 5 10 15
Figure 7-5. Graph of the function y = x3/(ex-I).
(folder 'Chapter 07 Examples', workbook 'Area under Curve', worksheet 'Curve2 by worksheet')
Part of the data table is shown in Figure 7-6, along with the area under the
curve calculated by the trapezoidal approximation. The result returned by the
custom function
=curvarea($B$4:$B$39,$A$4:$A$39)