
Page 152 - Excel for Scientists and Engineers: Numerical Methods
P. 152
CHAPTER 7 INTEGRATION 129
(7-3)
The 1/3 rule requires an even number of panels; thus the number of data
points n must be an odd number. If n is even, the area of the first or last panel
can be calculated using the trapezoid formula. The end panel to be so calculated
should be the one in which the function is more linear.
Simpson's 3/8 rule (equation 7-4) approximates the area by a cubic
interpolating polynomial, evaluates the area of three panels of equal width, and
requires four data points for each element of area.
(7-4)
The 3/8 rule is often used when evaluating the area under a curve described
by an odd number of panels: the first or last three panels are evaluated using the
3/8 rule, and the remainder by the 1/3 rule.
Calculating the Area under a Curve
Defined by a Table of Data Points
In the fields of toxicology and pharmacology, the area under the curve of a
plot of plasma concentration of a drug versus elapsed time after administration of
the drug has a number of important uses. The area can used to calculate the total
body clearance and the apparent volume of distribution.
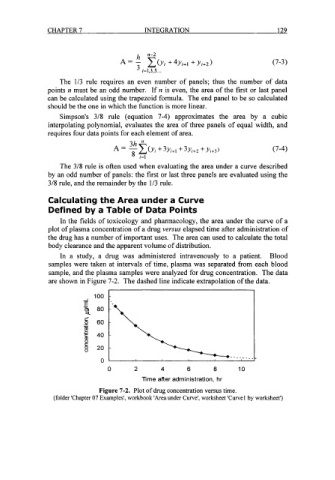
In a study, a drug was administered intravenously to a patient. Blood
samples were taken at intervals of time, plasma was separated from each blood
sample, and the plasma samples were analyzed for drug concentration. The data
are shown in Figure 7-2. The dashed line indicate extrapolation of the data.
100
-1
E
80
g- 60
s 40
2
8 20
0
0 2 4 6 8 10
Time after administration, hr
Figure 7-2. Plot of drug concentration versus time.
(folder 'Chapter 07 Examples', workbook 'Area under Curve', worksheet 'Curve1 by worksheet')