
Page 151 - Excel for Scientists and Engineers: Numerical Methods
P. 151
128 EXCEL: NUMERICAL METHODS
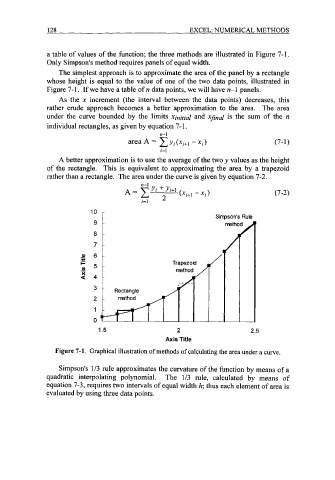
a table of values of the function; the three methods are illustrated in Figure 7-1.
Only Simpson's method requires panels of equal width.
The simplest approach is to approximate the area of the panel by a rectangle
whose height is equal to the value of one of the two data points, illustrated in
Figure 7-1. If we have a table of n data points, we will have n-1 panels.
As the x increment (the interval between the data points) decreases, this
rather crude approach becomes a better approximation to the area. The area
under the curve bounded by the limits xjnitial and XJnar is the sum of the n
individual rectangles, as given by equation 7-1.
n-1
area A = ~yi(xj+l xi) (7- 1)
-
i=l
A better approximation is to use the average of the two y values as the height
of the rectangle. This is equivalent to approximating the area by a trapezoid
rather than a rectangle. The area under the curve is given by equation 7-2.
10
9
a
7
0
- 6
C
i=
.- 5
a
2 4
3
2
1
0
1.5 2 2.5
Axis Title
Figure 7-1. Graphical illustration of methods of calculating the area under a curve.
Simpson's 1/3 rule approximates the curvature of the function by means of a
quadratic interpolating polynomial. The 1/3 rule, calculated by means of
equation 7-3, requires two intervals of equal width h; thus each element of area is
evaluated by using three data points.