
Page 295 - Excel for Scientists and Engineers: Numerical Methods
P. 295
212 EXCEL: NUMERICAL METHODS
An Example: Heat Conduction in a Brass Rod
Consider an insulated 10-cm brass rod, initially at a temperature of 0°C. One
end of the rod is heated to 100°C. Equation 12-20 describes the heat flow in the
rod as a hnction of time. (For simplicity, we assume that there is no heat loss
through the sides of the rod.) For brass, the coefficient of thermal conductivity k
is 0.26 cal s-' cm-' deg-', the heat capacity c is 0.094 cal g-' deg-' and the density
p is 8.4 g ~m-~. From these values, the coefficient k in equation 12-22 is 3.04 s
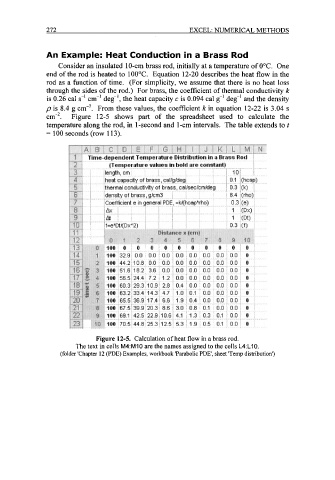
cm-*. Figure 12-5 shows part of the spreadsheet used to calculate the
temperature along the rod, in 1-second and 1-cm intervals. The table extends to t
= 100 seconds (row 1 13).
Figure 12-5. Calculation of heat flow in a brass rod.
The text in cells M4:MlO are the names assigned to the cells L4:LlO.
(folder 'Chapter 12 (PDE) Examples, workbook 'Parabolic PDE', sheet 'Temp distribution')