
Page 300 - Excel for Scientists and Engineers: Numerical Methods
P. 300
CHAPTER 12 PARTIAL DIFFERENTIAL EQUATIONS 277
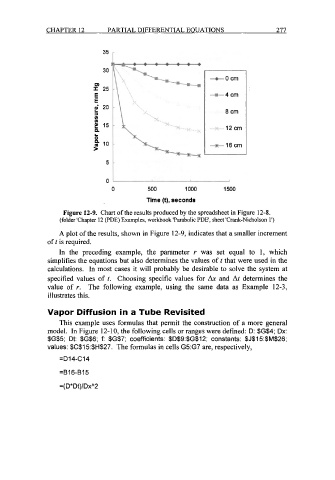
Figure 12-9. Chart of the results produced by the spreadsheet in Figure 12-8.
(folder 'Chapter 12 (PDE) Examples, workbook 'Parabolic PDE', sheet 'Crank-Nicholson 1')
A plot of the results, shown in Figure 12-9, indicates that a smaller increment
oft is required.
In the preceding example, the parameter r was set equal to 1, which
simplifies the equations but also determines the values oft that were used in the
calculations. In most cases it will probably be desirable to solve the system at
specified values oft. Choosing specific values for Ax and At determines the
value of r. The following example, using the same data as Example 12-3,
illustrates this.
Vapor Diffusion in a Tube Revisited
This example uses formulas that permit the construction of a more general
model. In Figure 12-1 0, the following cells or ranges were defined: D: $G$4; Dx:
$G$5; Dt: $G$6; f: $G$7; coefficients: $D$9:$G$12; constants: $J$I 5:$M$26;
values: $C$15:$H$27. The formulas in cells G5:G7 are, respectively,
=D14-C14
=B16-B15
=( D*Dt)/DxY