
Page 301 - Excel for Scientists and Engineers: Numerical Methods
P. 301
278 EXCEL: NUMERICAL METHODS
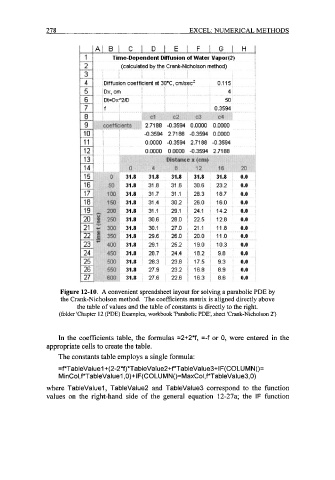
Figure 12-10. A convenient spreadsheet layout for solving a parabolic PDE by
the Crank-Nicholson method. The coefficients matrix is aligned directly above
the table of values and the table of constants is directly to the right.
(folder 'Chapter 12 (PDE) Examples, workbook 'Parabolic PDE', sheet 'Crank-Nicholson 2')
In the coefficients table, the formulas =2+2*f, =-f or 0, were entered in the
appropriate cells to create the table.
The constants table employs a single formula:
=PTa bleValu e 1 +( 2-2*f)*Ta bleVa lue2+f*Ta bleVa I ue3+ I F( COL U M N ()=
MinCol,f*TableValuel ,O)+IF(COLUMN()=MaxCol,f*TableValue3,0)
where TableValuel , TableValue2 and TableValue3 correspond to the function
values on the right-hand side of the general equation 12-27a; the IF function