
Page 343 - Excel for Scientists and Engineers: Numerical Methods
P. 343
320 EXCEL: NUMERICAL METHODS
The formulas in cells CIO, D10 and El0 are, respectively,
=C-A*k-l*( EXP(-k-2*t)-EXP(-k-l *t))/(k-I -k-2)
=E-B*0.4*CI 0
=(BI 0-D10)"2
Range names were used in these formulas; the names assigned to cells are
shown in parentheses in the cell to the right of each named cell.
The three changing cells ($E$6, $E$7 and $B$7) and the target cell ($E$26)
are in bold. The initial values are guesses based on the appearance of the data in
Figure 14-1. More specifically, the guesses were based on the rise time, decay
time and maximum of the data, but if you experiment with the Solver you will
see that much poorer guesses will almost always lead to the correct answer.
(A good way to get initial values for the changing cells is to create a chart of
the data, then vary the coefficients in order to get an approximate fit of the
calculated curve to the experimental data points.)
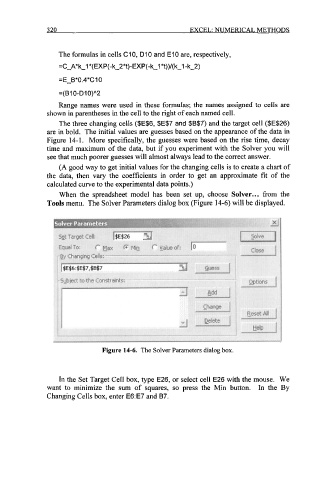
When the spreadsheet model has been set up, choose Solver... from the
Tools menu. The Solver Parameters dialog box (Figure 14-6) will be displayed.
Figure 14-6. The Solver Parameters dialog box.
In the Set Target Cell box, type E26, or select cell E26 with the mouse. We
want to minimize the sum of squares, so press the Min button. In the By
Changing Cells box, enter E6:E7 and B7.