
Page 342 - Excel for Scientists and Engineers: Numerical Methods
P. 342
CHAPTER 14 NONLINEAR REGRESSION USING THE SOLVER 319
where E~ is the molar absorptivity (a constant dependent on the chemical species
and the wavelength, and thus a third unknown quantity in this example).
Therefore three curve-fitting coefficients (k,, k2 and E~) must be varied in this
example. If two variable coefficients produce an error surface in three
dimensions, as illustrated in Figure 14-3, then varying three coefficients requires
that we work in four dimensions!
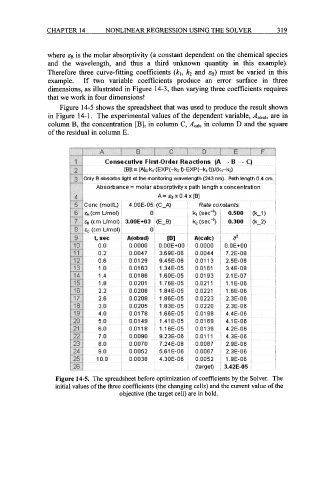
Figure 14-5 shows the spreadsheet that was used to produce the result shown
in Figure 14-1. The experimental values of the dependent variable, Aobsd, are in
column B, the concentration [B], in column C, Acalc in column D and the square
of the residual in column E.
Figure 14-5. The spreadsheet before optimization of coefficients by the Solver. The
initial values of the three coefficients (the changing cells) and the current value of the
objective (the target cell) are in bold.