
Page 338 - Excel for Scientists and Engineers: Numerical Methods
P. 338
CHAPTER 14 NONLINEAR REGRESSION USNG THE SOLVER 315
k, = 0.64 in Figure 14-2) become the new initial estimates and the process is
repeated, using smaller bracketing values. Years ago this procedure, called "pit-
mapping," was performed on early digital computers.
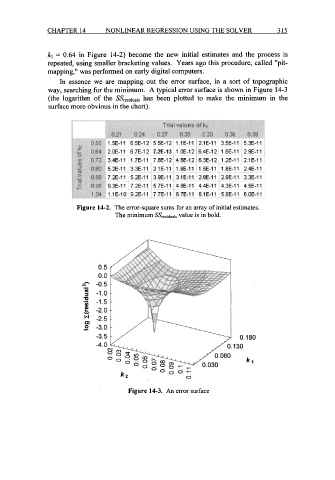
In essence we are mapping out the error surface, in a sort of topographic
way, searching for the minimum. A typical error surface is shown in Figure 14-3
(the logarithm of the SSresiduals has been plotted to make the minimum in the
surface more obvious in the chart).
Figure 14-2. The error-square sums for an array of initial estimates.
The minimum SSresiduals value is in bold.
Figure 14-3. An error surface