
Page 211 - Failure Analysis Case Studies II
P. 211
196
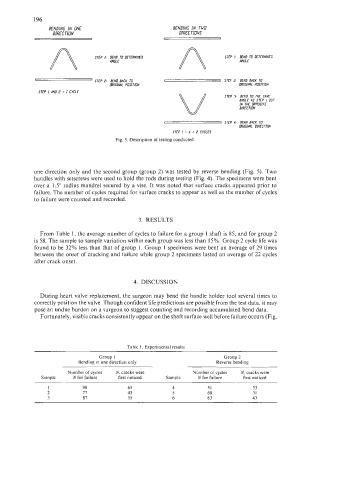
BENDING IN ON€ BENDING IN TM
DIREC TIUN DIRECTIONS
I STEP a BEND BACK ro I 1 STEP BEND BACK TO
GWGIML POSITION ORIGINAL POSITION
STEP I AND 2 = I CYCLE
SrCP 3 BEND TO 1s SAW
ANGLE AS STEP 1 BUT
IN TIC LPPOSITE
DIRCCTION
I STEP 4, BEND BACK TO
ORIGINAL DIRCCTION
STLP 1 - 4 = 2 CYCLES
Fig. 5. Description of testing conducted.
one direction only and the second group (group 2) was tested by reverse bending (Fig. 5). Two
handles with setscrews were used to hold the rods during testing (Fig. 4). The specimens were bent
over a 1.5” radius mandrel secured by a vise. It was noted that surface cracks appeared prior to
failure. The number of cycles required for surface cracks to appear as well as the number of cycles
to failure were counted and recorded.
3. RESULTS
From Table 1, the average number of cycles to failure for a group 1 shaft is 85, and for group 2
is 58. The sample to sample variation within each group was less than 15%. Group 2 cycle life was
found to be 32% less than that of group 1. Group 1 specimens were bent an average of 29 times
between the onset of cracking and failure while group 2 specimens lasted an average of 22 cycles
after crack onset.
4. DISCUSSION
During heart valve replacement, the surgeon may bend the handle holder tool several times to
correctly position the valve. Though confident life predictions are possible from the test data, it may
pose an undue burden on a surgeon to suggest counting and recording accumulated bend data.
Fortunately, visible cracks consistently appear on the shaft surface well before failure occurs (Fig.
Table I. Experimental results
Group I Group 2
Bending in one direction only Reverse bending
Number of cycles N, cracks were Number of cycles N, cracks were
Sample N for failure first noticed Sample N for failure first noticed
I 90 65 4 51 33
2 77 45 5 60 31
3 87 55 6 63 43