
Page 353 - Failure Analysis Case Studies II
P. 353
338
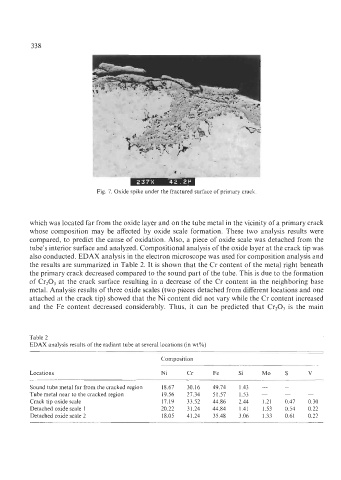
Fig. 7. Oxide spike under the fractured surface of primary crack.
which was located far from the oxide layer and on the tube metal in the vicinity of a primary crack
whose composition may be affected by oxide scale formation. These two analysis results were
compared, to predict the cause of oxidation. Also, a piece of oxide scale was detached from the
tube’s interior surface and analyzed. Compositional analysis of the oxide layer at the crack tip was
also conducted. EDAX analysis in the electron microscope was used for composition analysis and
the results are summarized in Table 2. It is shown that the Cr content of the metal right beneath
the primary crack decreased compared to the sound part of the tube. This is due to the formation
of Cr203 at the crack surface resulting in a decrease of the Cr content in the neighboring base
metal. Analysis results of three oxide scales (two pieces detached from different locations and one
attached at the crack tip) showed that the Ni content did not vary while the Cr content increased
and the Fe content decreased considerably. Thus, it can be predicted that Cr,03 is the main
Table 2
EDAX analysis results of the radiant tube at several locations (in wt%)
Composition
Locations Ni Cr Fe Si Mo S V
Sound tube metal far from the cracked region 18.67 30.16 49.74 1.43 - - -
Tube metal near to the cracked region 19.56 27.34 51.57 1.53 - - -
Crack tip oxide scale 17.19 33.52 44.86 2.44 1.21 0.47 0.30
Detached oxide scale 1 20.22 31.24 44.84 1.41 1.53 0.54 0.22
Detached oxide scale 2 18.05 41.24 35.48 3.06 1.33 0.61 0.22