
Page 131 - Fiber Fracture
P. 131
116 A. Sayir and S.C. Farmer
800
4
600 00 Stress Hupture
Stable Crack growth
400
200
Safe Stress
0
0 50 100 150 200
Time to Failure, h
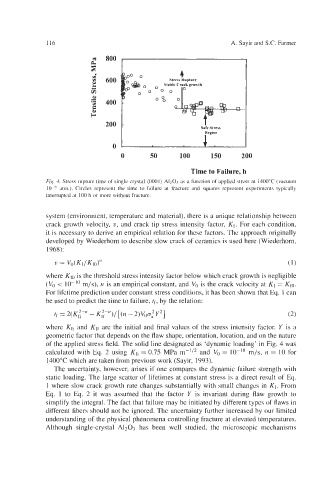
Fig 4. Stress rupture time of single-crystal (0001) A1203 as a function of applied stress at 1400°C (vacuum
lo-' atm.). Circles represent the time to failure at fracture and squares represent experiments typically
interrupted at 100 h or more without fracture.
system (environment, temperature and material), there is a unique relationship between
crack growth velocity, v, and crack tip stress intensity factor, KI. For each condition,
it is necessary to derive an empirical relation for these factors. The approach originally
developed by Wiederhorn to describe slow crack of ceramics is used here (Wiederhorn,
1968):
v = VOWI/KIO)" (1 1
where Klo is the threshold stress intensity factor below which crack growth is negligible
(VO < lo-'' m/s), n is an empirical constant, and VO is the crack velocity at KI = KIo.
For lifetime prediction under constant stress conditions, it has been shown that Eq. 1 can
be used to predict the time to failure, tf, by the relation:
where KI~ and KIf are the initial and final values of the stress intensity factor. Y is a
geometric factor that depends on the flaw shape, orientation, location, and on the nature
of the applied stress field. The solid line designated as 'dynamic loading' in Fig. 4 was
calculated with Eq. 2 using KI~ = 0.75 MPa m-'/' and VO = lo-'' m/s, n = 10 for
1400°C which are taken from previous work (Sayir, 1993).
The uncertainty, however, arises if one compares the dynamic failure strength with
static loading. The large scatter of lifetimes at constant stress is a direct result of Eq.
1 where slow crack growth rate changes substantially with small changes in KI. From
Eq. 1 to Eq. 2 it was assumed that the factor Y is invariant during flaw growth to
simplify the integral. The fact that failure may be initiated by different types of flaws in
different fibers should not be ignored. The uncertainty further increased by our limited
understanding of the physical phenomena controlling fracture at elevated temperatures.
Although single-crystal A1203 has been well studied, the microscopic mechanisms