
Page 133 - Fiber Fracture
P. 133
118 A. Sayir and S.C. Farmer
-2 6
4.5
5
5.5
6
6.4 6.9 7.4 7.9 t
Tensile Strength, In (yi)
(MPa)
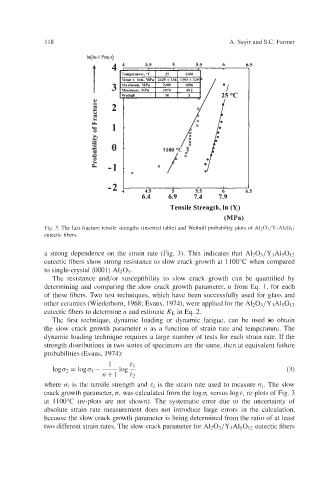
Fig. 5. The fast-fracture tensile strengths (inserted table) and Weibull probability plots of A120~/Y~AI~O12
eutectic fibers.
a strong dependence on the strain rate (Fig. 3). This indicates that AIzO~/Y~AI~O~~
eutectic fibers show strong resistance to slow crack growth at 1100°C when compared
to single-crystal (0001) A1203.
The resistance and/or susceptibility to slow crack growth can be quantified by
determining and comparing the slow crack growth parameter, n from Eq. 1, for each
of these fibers. Two test techniques, which have been successfully used for glass and
other ceramics (Wiederhorn, 1968; Evans, 1974), were applied for the A1203/Y3AI5O12
eutectic fibers to determine n and estimate KI~ Eq. 2.
in
The first technique, dynamic loading or dynamic fatigue, can be used $e obtain
the slow crack growth parameter n as a function of strain rate and temperature. The
dynamic loading technique requires a large number of tests for each strain rate. If the
strength distributions in two series of specimens are the same, then at equivalent failure
probabilities (Evans, 1974):
1 i.1
log
logo2 = logq - - 7 (3)
n+l E2
where ai is the tensile strength and ~i is the strain rate used to measure q. The slow
crack growth parameter, n, was calculated from the logq versus log ~i re-plots of Fig. 3
at 1100°C (re-plots are not shown). The systematic error due to the uncertainty of
absolute strain rate measurement does not introduce large errors in the calculation,
because the slow crack growth parameter is being determined from the ratio of at least
two different strain rates. The slow crack parameter for A1203/Y3A15012 eutectic fibers