
Page 223 - Fiber Fracture
P. 223
208 H.U. Riinzi
7
t3
-
v1
Y
-
0
Z-1
-5
lO'OOO/T [ K']
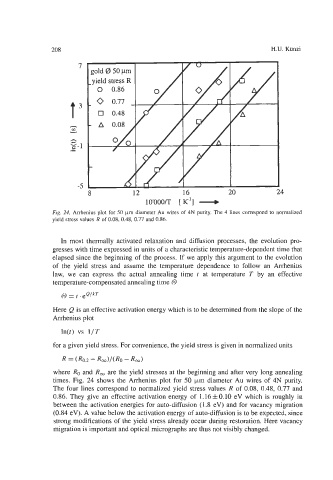
Fig. 24. Arrhenius plot for 50 prn diameter Au wires of 4N purity. The 4 lines correspond to normalized
yield stress values R of 0.08,0.48, 0.77 and 0.86.
In most thermally activated relaxation and diffusion processes, the evolution pro-
gresses with time expressed in units of a characteristic temperature-dependent time that
elapsed since the beginning of the process. If we apply this argument to the evolution
of the yield stress and assume the temperature dependence to follow an Arrhenius
law, we can express the actual annealing time t at temperature T by an effective
temperature-compensated annealing time 0
Here Q is an effective activation energy which is to be determined from the slope of the
Arrhenius plot
In(t) vs 1/T
for a given yield stress. For convenience, the yield stress is given in normalized units
R = (R0.2 - R,)/(Ro - Rea)
where Ro and R, are the yield stresses at the beginning and after very long annealing
times. Fig. 24 shows the Arrhenius plot for 50 km diameter Au wires of 4N punty.
The four lines correspond to normalized yield stress values R of 0.08, 0.48, 0.77 and
0.86. They give an effective activation energy of 1.16 & 0.10 eV which is roughly in
between the activation energies for auto-diffusion (1.8 eV) and for vacancy migration
(0.84 eV). A value below the activation energy of auto-diffusion is to be expected, since
strong modifications of the yield stress already occur during restoration. Here vacancy
migration is important and optical micrographs are thus not visibly changed.