
Page 224 - Fiber Fracture
P. 224
STRENGTH AND FRACTURE OF METALLIC FILAMENTS 209
In (t. exp(-QkT)) 4
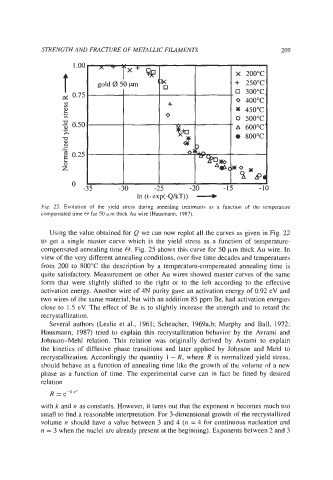
Fig. 25. Evolution of the yield stress during annealing treatments as a function of the temperature
compensated time H for 50 Km thick Au wire (Hausmann, 1987).
Using the value obtained for Q we can now replot all the curves as given in Fig. 22
to get a single master curve which is the yield stress as a function of temperature-
compensated annealing time 0. Fig. 25 shows this curve for 50 pm thick Au wire. In
view of the very different annealing conditions, over five time decades and temperatures
from 200 to 800°C the description by a temperature-compensated annealing time is
quite satisfactory. Measurement on other Au wires showed master curves of the same
form that were slightly shifted to the right or to the left according to the effective
activation energy. Another wire of 4N purity gave an activation energy of 0.92 eV and
two wires of the same material, but with an addition 85 ppm Be, had activation energies
close to 1.5 eV. The effect of Be is to slightly increase the strength and to retard the
recrystallization.
Several authors (Leslie et al., 1961; Scheucher, 1969a,b; Murphy and Ball, 1972;
Hausmann, 1987) tried to explain this recrystallization behavior by the Avrami and
Johnson-Mehl relation. This relation was originally derived by Avrami to explain
the kinetics of diffusive phase transitions and later applied by Johnson and Mehl to
recrystallization. Accordingly the quantity 1 - R, where R is normalized yield stress,
should behave as a function of annealing time like the growth of the volume of a new
phase as a function of time. The experimental curve can in fact be fitted by desired
relation
R = e-k.t"
with k and n as constants. However, it turns out that the exponent n becomes much too
small to find a reasonable interpretation. For 3-dimensional growth of the recrystallized
volume n should have a value between 3 and 4 (n = 4 for continuous nucleation and
a = 3 when the nuclei are already present at the beginning). Exponents between 2 and 3