
Page 103 - Finite Element Analysis with ANSYS Workbench
P. 103
94 Chapter 5 Plate Bending analysis
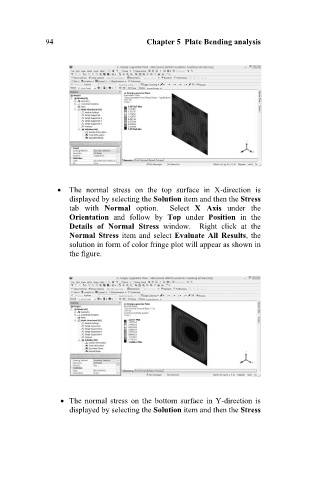
The normal stress on the top surface in X-direction is
displayed by selecting the Solution item and then the Stress
tab with Normal option. Select X Axis under the
Orientation and follow by Top under Position in the
Details of Normal Stress window. Right click at the
Normal Stress item and select Evaluate All Results, the
solution in form of color fringe plot will appear as shown in
the figure.
The normal stress on the bottom surface in Y-direction is
displayed by selecting the Solution item and then the Stress