
Page 140 - Finite Element Analysis with ANSYS Workbench
P. 140
7.3 Academic Example 131
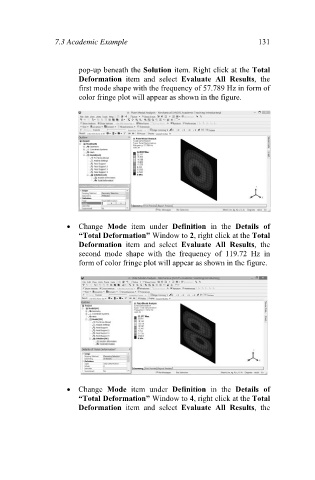
pop-up beneath the Solution item. Right click at the Total
Deformation item and select Evaluate All Results, the
first mode shape with the frequency of 57.789 Hz in form of
color fringe plot will appear as shown in the figure.
Change Mode item under Definition in the Details of
“Total Deformation” Window to 2, right click at the Total
Deformation item and select Evaluate All Results, the
second mode shape with the frequency of 119.72 Hz in
form of color fringe plot will appear as shown in the figure.
Change Mode item under Definition in the Details of
“Total Deformation” Window to 4, right click at the Total
Deformation item and select Evaluate All Results, the