
Page 213 - Flexible Robotics in Medicine
P. 213
200 Chapter 8
Table 8.2: Nitinol properties used for the first group of simulation.
Poisson’s
Model type Yield strength Tensile strength Elastic modulus ratio Mass density
Linear elastic 1.4e 1 008 N/m 2 8.95e 1 008 N/m 2 4e 1 010 N/m 2 0.33 6450 kg/m 3
isotropic
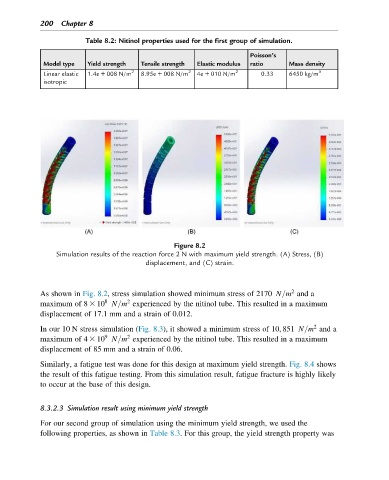
Figure 8.2
Simulation results of the reaction force 2 N with maximum yield strength. (A) Stress, (B)
displacement, and (C) strain.
2
As shown in Fig. 8.2, stress simulation showed minimum stress of 2170 N=m and a
8
2
maximum of 8 3 10 N=m experienced by the nitinol tube. This resulted in a maximum
displacement of 17.1 mm and a strain of 0.012.
2
In our 10 N stress simulation (Fig. 8.3), it showed a minimum stress of 10; 851 N=m and a
9
2
maximum of 4 3 10 N=m experienced by the nitinol tube. This resulted in a maximum
displacement of 85 mm and a strain of 0.06.
Similarly, a fatigue test was done for this design at maximum yield strength. Fig. 8.4 shows
the result of this fatigue testing. From this simulation result, fatigue fracture is highly likely
to occur at the base of this design.
8.3.2.3 Simulation result using minimum yield strength
For our second group of simulation using the minimum yield strength, we used the
following properties, as shown in Table 8.3. For this group, the yield strength property was