
Page 214 - Flexible Robotics in Medicine
P. 214
Compliant bending tubular mechanisms with variable groove patterns 201
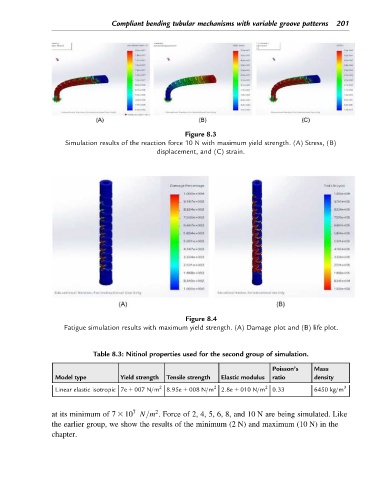
Figure 8.3
Simulation results of the reaction force 10 N with maximum yield strength. (A) Stress, (B)
displacement, and (C) strain.
Figure 8.4
Fatigue simulation results with maximum yield strength. (A) Damage plot and (B) life plot.
Table 8.3: Nitinol properties used for the second group of simulation.
Poisson’s Mass
Model type Yield strength Tensile strength Elastic modulus ratio density
Linear elastic isotropic 7e 1 007 N/m 2 8.95e 1 008 N/m 2 2.8e 1 010 N/m 2 0.33 6450 kg/m 3
7
2
at its minimum of 7 3 10 N=m . Force of 2, 4, 5, 6, 8, and 10 N are being simulated. Like
the earlier group, we show the results of the minimum (2 N) and maximum (10 N) in the
chapter.