
Page 215 - Flexible Robotics in Medicine
P. 215
202 Chapter 8
Figure 8.5
Simulation results of the reaction force 2 N with minimum yield strength. (A) Stress, (B)
displacement, and (C) strain.
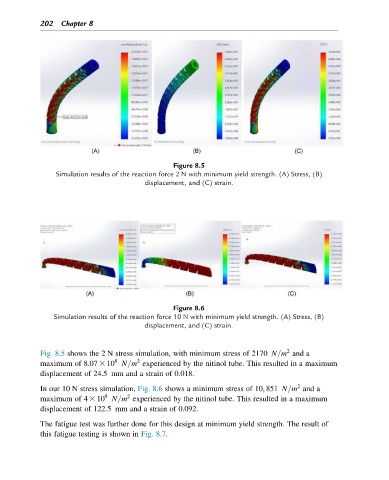
Figure 8.6
Simulation results of the reaction force 10 N with minimum yield strength. (A) Stress, (B)
displacement, and (C) strain.
2
Fig. 8.5 shows the 2 N stress simulation, with minimum stress of 2170 N=m and a
8
2
maximum of 8:07 3 10 N=m experienced by the nitinol tube. This resulted in a maximum
displacement of 24:5 mm and a strain of 0.018.
2
In our 10 N stress simulation, Fig. 8.6 shows a minimum stress of 10; 851 N=m and a
9
2
maximum of 4 3 10 N=m experienced by the nitinol tube. This resulted in a maximum
displacement of 122:5 mm and a strain of 0.092.
The fatigue test was further done for this design at minimum yield strength. The result of
this fatigue testing is shown in Fig. 8.7.