
Page 65 - Fluid Power Engineering
P. 65
42 Cha pte r T w o
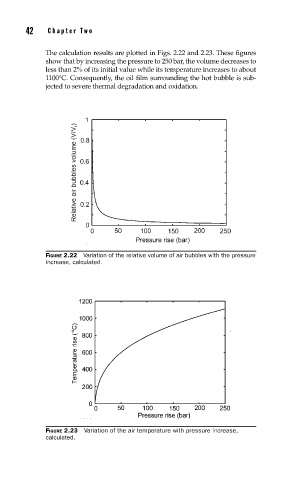
The calculation results are plotted in Figs. 2.22 and 2.23. These figures
show that by increasing the pressure to 250 bar, the volume decreases to
less than 2% of its initial value while its temperature increases to about
1100°C. Consequently, the oil film surrounding the hot bubble is sub-
jected to severe thermal degradation and oxidation.
FIGURE 2.22 Variation of the relative volume of air bubbles with the pressure
increase, calculated.
FIGURE 2.23 Variation of the air temperature with pressure increase,
calculated.