
Page 122 - Forensic Structural Engineering Handbook
P. 122
CONSTRUCTION SAFETY CODES, STANDARDS, AND REGULATIONS 3.7
Ontario, Canada Japan United Kingdom
(1991 & 1992) (1989 & 1991) (1981–1990)
Struck by Struck by Struck by
Falls 24.0% Falls 24.0% Falls 25.0%
46.0% 45.0% 52.0%
Other Other Other
13.0% 10.0% 6.0%
Caught in Shock Caught in Shock Caught in Shock
14.0% 3.0% 19.0% 2.0% 12.0% 5.0%
Sweden United States Germany
(1986–1991) (1985–1989) (1987–1991)
Struck by Struck by Struck by
32.0% 22.0% 18.0%
Falls Falls Falls
44.0% 33.0% 55.0%
Other Other Other
14.0% 10.0% 12.0%
Caught in Shock Caught in Shock Caught in Shock
5.0% 5.0% 18.0% 17.0% 9.0% 6.0%
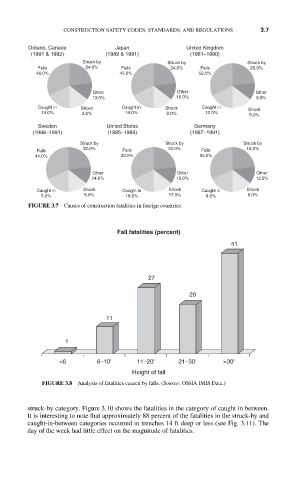
FIGURE 3.7 Causes of construction fatalities in foreign countries.
Fall fatalities (percent)
41
27
20
11
1
<6 6–10' 11–20' 21–30' >30'
Height of fall
FIGURE 3.8 Analysis of fatalities caused by falls. (Source: OSHA IMIS Data.)
struck-by category. Figure 3.10 shows the fatalities in the category of caught in between.
It is interesting to note that approximately 88 percent of the fatalities in the struck-by and
caught-in-between categories occurred in trenches 14 ft deep or less (see Fig. 3.11). The
day of the week had little effect on the magnitude of fatalities.