
Page 123 - Forensic Structural Engineering Handbook
P. 123
3.8 DESIGN AND CONSTRUCTION PRACTICES
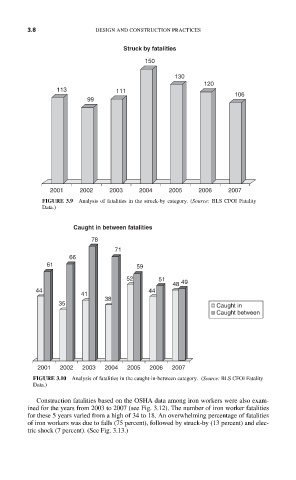
Struck by fatalities
150
130
120
113 111
106
99
2001 2002 2003 2004 2005 2006 2007
FIGURE 3.9 Analysis of fatalities in the struck-by category. (Source: BLS CFOI Fatality
Data.)
Caught in between fatalities
78
71
66
61 59
52 51
48 49
44 44
41
38
35 Caught in
Caught between
2001 2002 2003 2004 2005 2006 2007
FIGURE 3.10 Analysis of fatalities in the caught-in-between category. (Source: BLS CFOI Fatality
Data.)
Construction fatalities based on the OSHA data among iron workers were also exam-
ined for the years from 2003 to 2007 (see Fig. 3.12). The number of iron worker fatalities
for these 5 years varied from a high of 34 to 18. An overwhelming percentage of fatalities
of iron workers was due to falls (75 percent), followed by struck-by (13 percent) and elec-
tric shock (7 percent). (See Fig. 3.13.)