
Page 119 - Forensic Structural Engineering Handbook
P. 119
3.4 DESIGN AND CONSTRUCTION PRACTICES
Injury /illness rates
7.9
7.1
6.8
6.4 6.3
5.9
5.7
5.3 5.4
5
4.8
4.6 4.4
4.2
Construction
All industries
2001 2002 2003 2004 2005 2006 2007
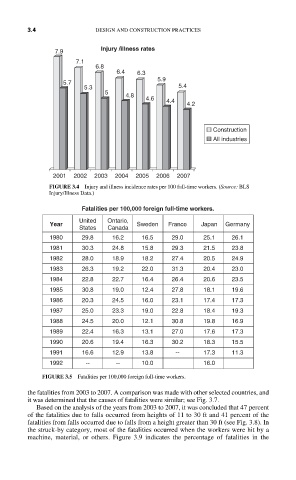
FIGURE 3.4 Injury and illness incidence rates per 100 full-time workers. (Source: BLS
Injury/Illness Data.)
Fatalities per 100,000 foreign full-time workers.
United Ontario,
Year Sweden France Japan Germany
States Canada
1980 29.8 16.2 16.5 29.0 25.1 26.1
1981 30.3 24.8 15.8 29.3 21.5 23.8
1982 28.0 18.9 18.2 27.4 20.5 24.9
1983 26.3 19.2 22.0 31.3 20.4 23.0
1984 22.8 22.7 16.4 26.4 20.6 23.5
1985 30.8 19.0 12.4 27.8 18.1 19.6
1986 20.3 24.5 16.0 23.1 17.4 17.3
1987 25.0 23.3 19.0 22.8 18.4 19.3
1988 24.5 20.0 12.1 30.8 19.8 16.9
1989 22.4 16.3 13.1 27.0 17.6 17.3
1990 20.6 19.4 16.3 30.2 18.3 15.5
1991 16.6 12.9 13.8 -- 17.3 11.3
1992 -- -- 10.0 16.0
FIGURE 3.5 Fatalities per 100,000 foreign full-time workers.
the fatalities from 2003 to 2007. A comparison was made with other selected countries, and
it was determined that the causes of fatalities were similar; see Fig. 3.7.
Based on the analysis of the years from 2003 to 2007, it was concluded that 47 percent
of the fatalities due to falls occurred from heights of 11 to 30 ft and 41 percent of the
fatalities from falls occurred due to falls from a height greater than 30 ft (see Fig. 3.8). In
the struck-by category, most of the fatalities occurred when the workers were hit by a
machine, material, or others. Figure 3.9 indicates the percentage of fatalities in the