
Page 118 - Forensic Structural Engineering Handbook
P. 118
CONSTRUCTION SAFETY CODES, STANDARDS, AND REGULATIONS 3.3
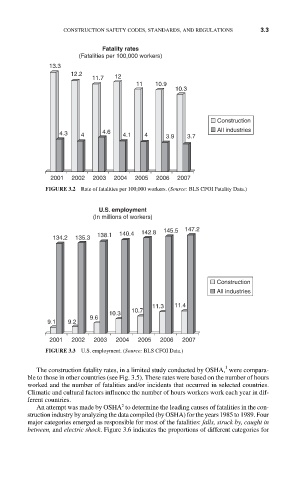
Fatality rates
(Fatalities per 100,000 workers)
13.3
12.2
11.7 12
11 10.9
10.3
Construction
4.3 4 4.6 4.1 4 3.9 3.7 All industries
2001 2002 2003 2004 2005 2006 2007
FIGURE 3.2 Rate of fatalities per 100,000 workers. (Source: BLS CFOI Fatality Data.)
U.S. employment
(In millions of workers)
138.1 140.4 142.8 145.5 147.2
134.2 135.3
Construction
All industries
11.3 11.4
10.7
10.3
9.6
9.1 9.2
2001 2002 2003 2004 2005 2006 2007
FIGURE 3.3 U.S. employment. (Source: BLS CFOI Data.)
1
The construction fatality rates, in a limited study conducted by OSHA, were compara-
ble to those in other countries (see Fig. 3.5). These rates were based on the number of hours
worked and the number of fatalities and/or incidents that occurred in selected countries.
Climatic and cultural factors influence the number of hours workers work each year in dif-
ferent countries.
2
An attempt was made by OSHA to determine the leading causes of fatalities in the con-
struction industry by analyzing the data compiled (by OSHA) for the years 1985 to 1989. Four
major categories emerged as responsible for most of the fatalities: falls, struck by, caught in
between, and electric shock. Figure 3.6 indicates the proportions of different categories for