Page 153 - Formation Damage during Improved Oil Recovery Fundamentals and Applications
P. 153

Formation Damage by Fines Migration: Mathematical and Laboratory Modeling, Field Cases  131


                              (A)  T
                                         X =X w +αT     X = X w + T


                                 T crI
                                 T mJ                 D
                                 T mI     B   C
                                      A
                                   X w  X mI  X mJ  X crI   X

                              (B)  T
                                         X = X w +αT  X =X mI +αT  X =X mJ +αT  X =X crI +αT  9
                                  T I               8   X =X w + T
                                     2
                                                7
                                 T crI
                                            6
                                 T mJ                  0
                                  T 3  4  5   1
                                 T mI
                                       3
                                   X w  X mI  X 3  X mJ  X crI  X I  X
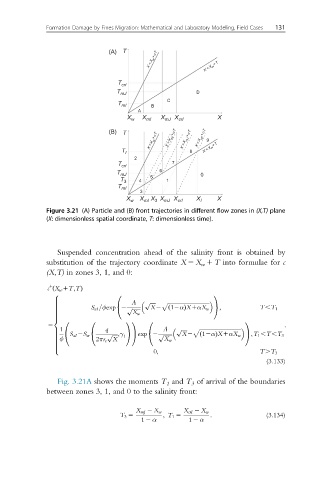
              Figure 3.21 (A) Particle and (B) front trajectories in different flow zones in (X,T) plane
              (X: dimensionless spatial coordinate, T: dimensionless time).


                 Suspended concentration ahead of the salinity front is obtained by
              substitution of the trajectory coordinate X 5 X w 1 T into formulae for c
              (X,T) in zones 3, 1, and 0:
              1
               ð
              c X w 1T;TÞ
               8                0                          1
               >                     Λ    p   ffiffiffiffiffiffiffiffiffiffiffiffiffiffiffiffiffiffiffiffiffiffiffiffiffiffiffiffiffiffi
               >                          ffiffiffiffi p
               >
               >                   p      X2                ;
                                @             ð            A
                          S aI =φexp 2 ffiffiffiffiffiffi  12αÞX1αX w              T,T 1
               >
               >
               >                     X w
               >
               >
               <
              5   0      0         11    0                         1          :
                 1            q              Λ    p ffiffiffiffi p ffiffiffiffiffiffiffiffiffiffiffiffiffiffiffiffiffiffiffiffiffiffiffiffiffiffiffiffiffiffi
               >               ffiffiffiffi;γ
               >  @      @    p    AA    @  p     X2               A
                 φ
               >    S aI 2S cr    I   exp 2 ffiffiffiffiffiffi     ð 12αÞX1αX w  ;T 1 ,T,T 3
               >
               >           2πr e X           X w
               >
               >
               >
               >
                                          0;                           T.T 3
               :
                                                                         (3.133)
                 Fig. 3.21A shows the moments T 1 and T 3 of arrival of the boundaries
              between zones 3, 1, and 0 to the salinity front:
                                      X mJ 2 X w   X crI 2 X w
                                 T 3 5       ; T 1 5      :              (3.134)
                                       1 2 α        1 2 α
   148   149   150   151   152   153   154   155   156   157   158