
Page 149 - Formation Damage during Improved Oil Recovery Fundamentals and Applications
P. 149
128 Thomas Russell et al.
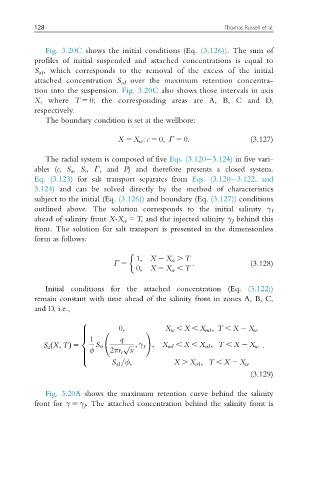
Fig. 3.20C shows the initial conditions (Eq. (3.126)).The sumof
profiles of initial suspended and attached concentrations is equal to
S aI , which corresponds to the removal of the excess of the initial
attached concentration S aI over the maximum retention concentra-
tion into the suspension. Fig. 3.20C also shows those intervals in axis
X,where T 5 0; thecorrespondingareas areA,B, C andD,
respectively.
The boundary condition is set at the wellbore:
X 5 X w : c 5 0; Γ 5 0: (3.127)
The radial system is composed of five Eqs. (3.120 3.124) in five vari-
ables (c, S a , S s , Γ, and P) and therefore presents a closed system.
Eq. (3.123) for salt transport separates from Eqs. (3.120 3.122, and
3.124) and can be solved directly by the method of characteristics
subject to the initial (Eq. (3.126)) and boundary (Eq. (3.127)) conditions
outlined above. The solution corresponds to the initial salinity γ I
ahead of salinity front X-X w 5 T, and the injected salinity γ J behind this
front. The solution for salt transport is presented in the dimensionless
form as follows:
1; X 2 X w . T
Γ 5 : (3.128)
0; X 2 X w , T
Initial conditions for the attached concentration (Eq. (3.122))
remain constant with time ahead of the salinity front in zones A, B, C,
and D, i.e.,
8
0;
> X w , X , X mI ; T , X 2 X w
> !
1 q
>
<
S a X; Tð Þ 5 S cr p ffiffiffi ; γ I ; X mI , X , X crI ; T , X 2 X w :
φ 2πr e x
>
>
>
S aI =φ; X . X crI ; T , X 2 X w
:
(3.129)
Fig. 3.20A shows the maximum retention curve behind the salinity
front for γ 5 γ J . The attached concentration behind the salinity front is