
Page 213 - Foundations of Cognitive Psychology : Core Readings
P. 213
218 Albert S. Bregman
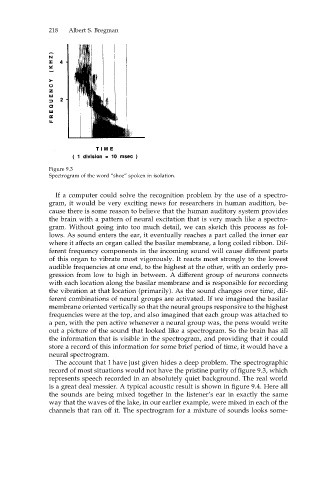
Figure 9.3
Spectrogram of the word ‘‘shoe’’ spoken in isolation.
If a computer could solve the recognition problem by the use of a spectro-
gram, it would be very exciting news for researchers in human audition, be-
cause there is some reason to believe that the human auditory system provides
the brain with a pattern of neural excitation that is very much like a spectro-
gram. Without going into too much detail, we can sketch this process as fol-
lows. As sound enters the ear, it eventually reaches a part called the inner ear
where it affects an organ called the basilar membrane, a long coiled ribbon. Dif-
ferent frequency components in the incoming sound will cause different parts
of this organ to vibrate most vigorously. It reacts most strongly to the lowest
audible frequencies at one end, to the highest at the other, with an orderly pro-
gression from low to high in between. A different group of neurons connects
with each location along the basilar membrane and is responsible for recording
the vibration at that location (primarily). As the sound changes over time, dif-
ferent combinations of neural groups are activated. If we imagined the basilar
membrane oriented vertically so that the neural groups responsive to the highest
frequencies were at the top, and also imagined that each group was attached to
a pen, with the pen active whenever a neural group was, the pens would write
out a picture of the sound that looked like a spectrogram. So the brain has all
the information that is visible in the spectrogram, and providing that it could
store a record of this information for some brief period of time, it would have a
neural spectrogram.
The account that I have just given hides a deep problem. The spectrographic
record of most situations would not have the pristine purity of figure 9.3, which
represents speech recorded in an absolutely quiet background. The real world
is a great deal messier. A typical acoustic result is shown in figure 9.4. Here all
the sounds are being mixed together in the listener’s ear in exactly the same
way that the waves of the lake, in our earlier example, were mixed in each of the
channels that ran off it. The spectrogram for a mixture of sounds looks some-