
Page 382 - T. Anderson-Fracture Mechanics - Fundamentals and Applns.-CRC (2005)
P. 382
1656_C008.fm Page 362 Monday, May 23, 2005 5:59 PM
362 Fracture Mechanics: Fundamentals and Applications
for metal specimens, but this load can be significant in plastic specimens. The conventional cantilever
clip gage design may be too stiff for soft polymer specimens; a ring-shaped gage may be more
suitable.
One may choose to infer the specimen displacement from the crosshead displacement. In such
cases it is necessary to correct for extraneous displacements due to the indentation of the specimen by
the test fixture. A displacement calibration can be inferred from a load-displacement curve for an
unnotched specimen. If the calibration curve is linear, the correction to displacement is relatively simple:
∆ ∆ = tot − CP (8.24)
i
where ∆ is the measured displacement and C is the compliance due to indentation. Since the
tot
i
deformation of the specimen is time dependent, the crosshead rate in the calibration experiment
should match that in the actual fracture toughness tests.
8.1.3 K TESTING
lc
The American Society for Testing and Materials (ASTM) has published a number of standards for
fracture testing of metals, which Chapter 7 describes. Committee D20 within ASTM developed a
standard method for K testing of plastics [10]. This standard was based on a protocol developed
Ic
by the European Structural Integrity Society (ESIS), which in turn was based on the ASTM K Ic
standard for metals, E 399 [12].
The ASTM K standard for plastics is very similar to E 399. Both test methods define an
Ic
apparent crack initiation load P by a 5% secant construction (Figure 7.13). This load must be
Q
greater than 1.1 times the maximum load in the test for the result to be valid. The provisional fracture
toughness K must meet the following specimen size requirements:
Q
K 2
Q
Ba ≥ 25 σ YS (8.25a)
.
,
a
045 ≤ . ≤ 055 (8.25b)
.
W
where
B = specimen thickness
a = crack length
W = specimen width, as defined in Figure 7.1
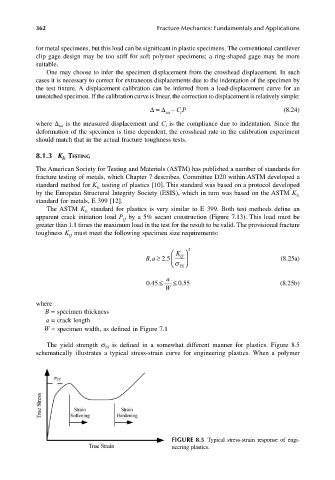
The yield strength σ is defined in a somewhat different manner for plastics. Figure 8.5
YS
schematically illustrates a typical stress-strain curve for engineering plastics. When a polymer
FIGURE 8.5 Typical stress-strain response of engi-
neering plastics.