
Page 387 - T. Anderson-Fracture Mechanics - Fundamentals and Applns.-CRC (2005)
P. 387
1656_C008.fm Page 367 Monday, May 23, 2005 5:59 PM
Fracture Testing of Nonmetals 367
Note that the J estimate in Equation (8.26) is not corrected for crack growth, nor is J separated
into elastic and plastic components as it is in ASTM E 1820.
The most common approach for inferring the J-R curve for a polymer is the multiple specimen
method. A set of nominally identical specimens are loaded to various displacements, and then
unloaded. The initial crack length and stable crack growth are measured optically from each specimen,
resulting in a series of data points on a J-∆a plot. Determining the initial crack length a is relatively
o
easy, but inferring the precise position of the final crack front in a given specimen is difficult. Several
techniques have been employed, including:
• Cooling the specimen and fracturing at either normal loading rates or at high impact rates
• Fracturing the specimen by impact loading at ambient temperature
• Fatigue cycling after the test
• Injecting ink onto the notch to mark the crack front
• Slicing the specimen into several sections and optically measuring the crack depth in
each section while it is under load
Each technique has advantages and disadvantages. When breaking open the specimen, whether at
normal or high loading rates, it is often difficult to discern the difference between crack propagation
during the test and posttest fracture. In some polymers, cooling in liquid nitrogen or fracturing at
high loading rates produces thumbnail-shaped features on the fracture surface, which lead to
significant overestimates of stable crack growth. Fatigue postcracking can be an effective means
to identify stable crack growth during the test, but it can also be time consuming. Sectioning is
also time consuming.
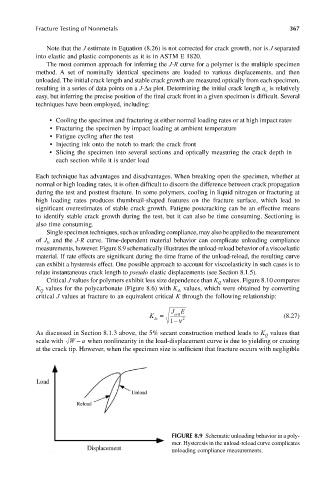
Single specimen techniques, such as unloading compliance, may also be applied to the measurement
of J and the J-R curve. Time-dependent material behavior can complicate unloading compliance
Ic
measurements, however. Figure 8.9 schematically illustrates the unload-reload behavior of a viscoelastic
material. If rate effects are significant during the time frame of the unload-reload, the resulting curve
can exhibit a hysteresis effect. One possible approach to account for viscoelasticity in such cases is to
relate instantaneous crack length to pseudo elastic displacements (see Section 8.1.5).
Critical J values for polymers exhibit less size dependence than K values. Figure 8.10 compares
Q
K values for the polycarbonate (Figure 8.6) with K values, which were obtained by converting
Q
Jc
critical J values at fracture to an equivalent critical K through the following relationship:
JE
K = crit (8.27)
Jc
1 −ν 2
As discussed in Section 8.1.3 above, the 5% secant construction method leads to K values that
Q
scale with W a − when nonlinearity in the load-displacement curve is due to yielding or crazing
at the crack tip. However, when the specimen size is sufficient that fracture occurs with negligible
FIGURE 8.9 Schematic unloading behavior in a poly-
mer. Hysteresis in the unload-reload curve complicates
unloading compliance measurements.