
Page 388 - T. Anderson-Fracture Mechanics - Fundamentals and Applns.-CRC (2005)
P. 388
1656_C008.fm Page 368 Monday, May 23, 2005 5:59 PM
368 Fracture Mechanics: Fundamentals and Applications
FIGURE 8.10 Size dependence of K Q and J-based fracture toughness for PC. Taken from Cayard, M., “Fracture
Toughness Testing of Polymeric Materials.” Ph.D. Dissertation, Texas A&M University, College Station, TX, 1990.
nonlinearity in the load-displacement curve, K = K = K . Note that the K values are independent
Jc
Jc
Q
Ic
of specimen size over the range of available data, despite material nonlinearity in the smaller specimens.
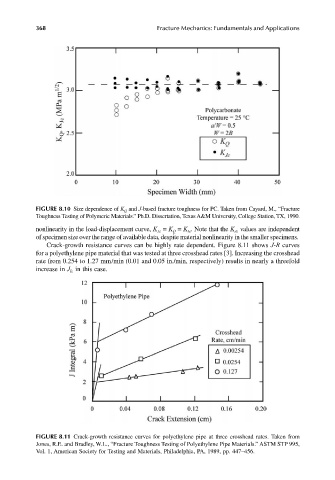
Crack-growth resistance curves can be highly rate dependent. Figure 8.11 shows J-R curves
for a polyethylene pipe material that was tested at three crosshead rates [3]. Increasing the crosshead
rate from 0.254 to 1.27 mm/min (0.01 and 0.05 in./min, respectively) results in nearly a threefold
increase in J in this case.
Ic
FIGURE 8.11 Crack-growth resistance curves for polyethylene pipe at three crosshead rates. Taken from
Jones, R.E. and Bradley, W.L., “Fracture Toughness Testing of Polyethylene Pipe Materials.” ASTM STP 995,
Vol. 1, American Society for Testing and Materials, Philadelphia, PA, 1989, pp. 447–456.