
Page 58 - T. Anderson-Fracture Mechanics - Fundamentals and Applns.-CRC (2005)
P. 58
1656_C02.fm Page 38 Thursday, April 14, 2005 6:28 PM
38 Fracture Mechanics: Fundamentals and Applications
The elastic compliance is given by
∆ 2 a 3
C = =
P 3 EI
Substituting C into Equation (2.30) gives
Pa 12 Pa 2
2
22
G = =
BE I Bh E
3
2
2.5 INSTABILITY AND THE R CURVE
Crack extension occurs when G = 2w ; but crack growth may be stable or unstable, depending on
f
how G and w vary with crack size. To illustrate stable and unstable behavior, it is convenient to
f
replace 2w with R, the material resistance to crack extension. A plot of R vs. crack extension is
f
called a resistance curve or R curve. The corresponding plot of G vs. crack extension is the driving
force curve.
Consider a wide plate with a through crack of initial length 2a (Figure 2.3). At a fixed remote
o
stress σ, the energy release rate varies linearly with crack size (Equation (2.24)). Figure 2.10 shows
schematic driving force vs. R curves for two types of material behavior.
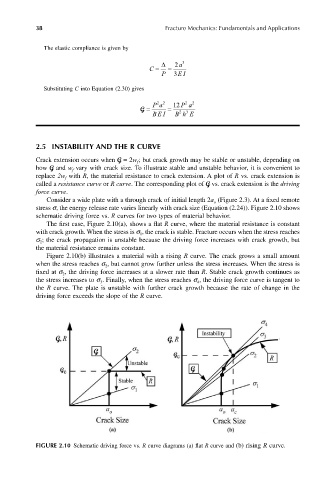
The first case, Figure 2.10(a), shows a flat R curve, where the material resistance is constant
with crack growth. When the stress is σ , the crack is stable. Fracture occurs when the stress reaches
1
σ ; the crack propagation is unstable because the driving force increases with crack growth, but
2
the material resistance remains constant.
Figure 2.10(b) illustrates a material with a rising R curve. The crack grows a small amount
when the stress reaches σ , but cannot grow further unless the stress increases. When the stress is
2
fixed at σ , the driving force increases at a slower rate than R. Stable crack growth continues as
2
the stress increases to σ . Finally, when the stress reaches σ , the driving force curve is tangent to
4
3
the R curve. The plate is unstable with further crack growth because the rate of change in the
driving force exceeds the slope of the R curve.
FIGURE 2.10 Schematic driving force vs. R curve diagrams (a) flat R curve and (b) rising R curve.