
Page 60 - T. Anderson-Fracture Mechanics - Fundamentals and Applns.-CRC (2005)
P. 60
1656_C02.fm Page 40 Thursday, April 14, 2005 6:28 PM
40 Fracture Mechanics: Fundamentals and Applications
The size and geometry of the cracked structure can exert some influence on the shape of the
R curve. A crack in a thin sheet tends to produce a steeper R curve than a crack in a thick plate
because there is a low degree of stress triaxiality at the crack tip in the thin sheet, while the
material near the tip of the crack in the thick plate may be in plane strain. The R curve can also
be affected if the growing crack approaches a free boundary in the structure. Thus, a wide plate
may exhibit a somewhat different crack growth resistance behavior than a narrow plate of the
same material.
Ideally, the R curve, as well as other measures of fracture toughness, should be a property only
of the material and not depend on the size or shape of the cracked body. Much of fracture mechanics
is predicated on the assumption that fracture toughness is a material property. Configurational
effects can occur, however. A practitioner of fracture mechanics should be aware of these effects
and their potential influence on the accuracy of an analysis. This issue is explored in detail in
Section 2.10, Section 3.5, and Section 3.6.
2.5.2 LOAD CONTROL VS. DISPLACEMENT CONTROL
According to Equation (2.32) and Equation (2.33), the stability of crack growth depends on the
rate of change in G, i.e., the second derivative of potential energy. Although the driving force G is
the same for both load control and displacement control, the rate of change of the driving force
curve depends on how the structure is loaded.
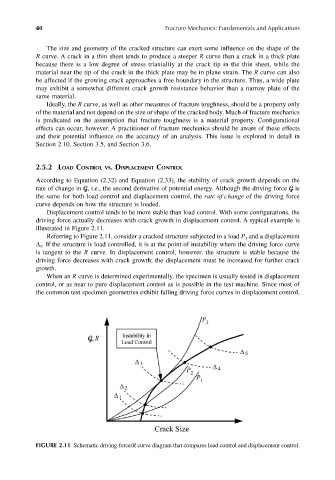
Displacement control tends to be more stable than load control. With some configurations, the
driving force actually decreases with crack growth in displacement control. A typical example is
illustrated in Figure 2.11.
Referring to Figure 2.11, consider a cracked structure subjected to a load P and a displacement
3
∆ . If the structure is load controlled, it is at the point of instability where the driving force curve
3
is tangent to the R curve. In displacement control, however, the structure is stable because the
driving force decreases with crack growth; the displacement must be increased for further crack
growth.
When an R curve is determined experimentally, the specimen is usually tested in displacement
control, or as near to pure displacement control as is possible in the test machine. Since most of
the common test specimen geometries exhibit falling driving force curves in displacement control,
FIGURE 2.11 Schematic driving force/R curve diagram that compares load control and displacement control.