
Page 235 - Fundamentals of Air Pollution 3E
P. 235
198 14. Ambient Air Pollutant Analysis and Measurement
TABLE 14-1
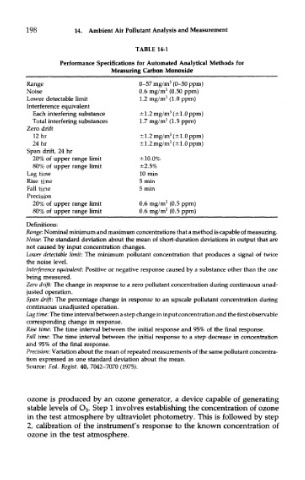
Performance Specifications for Automated Analytical Methods for
Measuring Carbon Monoxide
3
Range 0-57 mg/m (0-50 ppm)
3
Noise 0.6 mg/m (0.50 ppm)
3
Lower detectable limit 1.2 mg/m (1.0 ppm)
Interference equivalent
3
Each interfering substance ±1.2 mg/m (±1.0 ppm)
3
Total interfering substances 1.7 mg/m (1.5 ppm)
Zero drift
3
12 hr ±1.2 mg/m (±1.0 ppm)
3
24 hr ±1.2 mg/m (±1.0 ppm)
Span drift, 24 hr
20% of upper range limit ±10.0%
80% of upper range limit ±2.5%
Lag time 10 min
Rise time 5 min
Fall time 5 min
Precision
3
20% of upper range limit 0.6 mg/m (0.5 ppm)
3
80% of upper range limit 0.6 mg/m (0.5 ppm)
Definitions:
Range: Nominal minimum and maximum concentrations that a method is capable of measuring.
Noise: The standard deviation about the mean of short-duration deviations in output that are
not caused by input concentration changes.
Lower detectable limit: The minimum pollutant concentration that produces a signal of twice
the noise level.
Interference equivalent: Positive or negative response caused by a substance other than the one
being measured.
Zero drift: The change in response to a zero pollutant concentration during continuous unad-
justed operation.
Span drift: The percentage change in response to an upscale pollutant concentration during
continuous unadjusted operation.
Lag time: The time interval between a step change in input concentration and the first observable
corresponding change in response.
Rise time: The time interval between the initial response and 95% of the final response.
Fall time: The time interval between the initial response to a step decrease in concentration
and 95% of the final response.
Precision: Variation about the mean of repeated measurements of the same pollutant concentra-
tion expressed as one standard deviation about the mean.
Source: Fed. Regist. 40, 7042-7070 (1975).
ozone is produced by an ozone generator, a device capable of generating
stable levels of O 3. Step 1 involves establishing the concentration of ozone
in the test atmosphere by ultraviolet photometry. This is followed by step
2, calibration of the instrument's response to the known concentration of
ozone in the test atmosphere.