
Page 346 - Fundamentals of Air Pollution 3E
P. 346
III. Estimating Concentrations from Point Sources 301
(including daytime neutral) conditions; and T 0 is 50 for/ 2 for stable (including
nighttime neutral) conditions.
I. By Classification of Wind Direction Traces
Where specialized fluctuation data are not available, estimates of hori-
zontal spreading can be approximated from convential wind direction
traces. A method suggested by Smith (2) and Singer and Smith (10) uses
classification of the wind direction trace to determine the turbulence charac-
teristics of the atmosphere, which are then used to infer the dispersion.
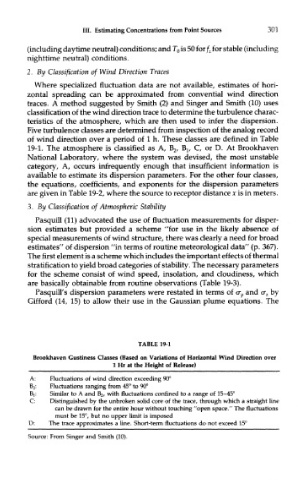
Five turbulence classes are determined from inspection of the analog record
of wind direction over a period of 1 h. These classes are defined in Table
19-1. The atmosphere is classified as A, B 2, B lr C, or D. At Brookhaven
National Laboratory, where the system was devised, the most unstable
category, A, occurs infrequently enough that insufficient information is
available to estimate its dispersion parameters. For the other four classes,
the equations, coefficients, and exponents for the dispersion parameters
are given in Table 19-2, where the source to receptor distance x is in meters.
3. By Classification of Atmospheric Stability
Pasquill (11) advocated the use of fluctuation measurements for disper-
sion estimates but provided a scheme "for use in the likely absence of
special measurements of wind structure, there was clearly a need for broad
estimates" of dispersion "in terms of routine meteorological data" (p. 367).
The first element is a scheme which includes the important effects of thermal
stratification to yield broad categories of stability. The necessary parameters
for the scheme consist of wind speed, insolation, and cloudiness, which
are basically obtainable from routine observations (Table 19-3).
Pasquill's dispersion parameters were restated in terms of a y and <r z by
Gifford (14, 15) to allow their use in the Gaussian plume equations. The
TABLE 19-1
Brookhaven Gustiness Classes (Based on Variations of Horizontal Wind Direction over
1 Hr at the Height of Release)
A: Fluctuations of wind direction exceeding 90°
B 2: Fluctuations ranging from 45° to 90°
Bj: Similar to A and B 2, with fluctuations confined to a range of 15-45°
C: Distinguished by the unbroken solid core of the trace, through which a straight line
can be drawn for the entire hour without touching "open space." The fluctuations
must be 15°, but no upper limit is imposed
D: The trace approximates a line. Short-term fluctuations do not exceed 15°
Source: From Singer and Smith (10).