
Page 347 - Fundamentals of Air Pollution 3E
P. 347
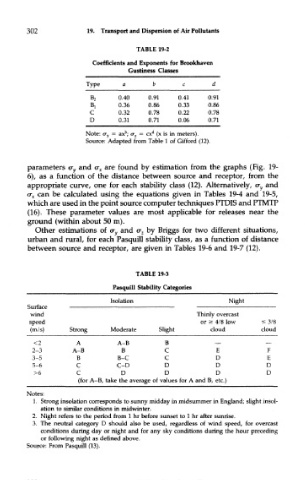
302             19. Transport and Dispersion of Air Pollutants

                                     TABLE 19-2
                         Coefficients and Exponents for Brookhaven
                                  C^iictinocc flaecoc
                       Type      a       b       c       d
                        B 2     0.40    0.91    0.41    0.91
                        B,      0.36    0.86    0.33    0.86
                        C       0.32    0.78    0.22    0.78
                        D       0.31    0.71    0.06    0.71
                                         d
                                 b
                       Note: cr y = ax ; cr z = oc  (x is in meters).
                       Source: Adapted from Table 1 of Gifford (12).
       parameters <j y and cr z are found by estimation from the graphs (Fig. 19-
       6), as a function of the distance between source and receptor, from the
       appropriate curve, one for each stability class (12). Alternatively, cr y and
       cr z can be calculated using the equations given in Tables 19-4 and 19-5,
       which are used in the point source computer techniques PTDIS and PTMTP
        (16). These parameter values are most applicable for releases near the
        ground (within about 50 m).
          Other estimations of cr y and cr z by Briggs for two different situations,
        urban and rural, for each Pasquill stability class, as a function of distance
       between source and receptor, are given in Tables 19-6 and 19-7 (12).


                                    TABLE 19-3

                              Pasquill Stability Categories
                              Isolation                      Night
       Surface
        wind                                         Thinly overcast
        speed                                         or ^ 4/8 low    =£3/8
        (m/s)      Strong     Moderate     Slight       cloud         cloud

         <2         A          A-B          B                          _
         2-3       A-B           B          C             E            F
         3-5         B         B-C          C             D            E
         5-6         C         C-D          D             D            D
         >6          C          D           D             D            D
                     (for A-B, take the average of values for A and B, etc.)
       Notes:
         1. Strong insolation corresponds to sunny midday in midsummer in England; slight insol-
           ation to similar conditions in midwinter.
         2. Night refers to the period from 1 hr before sunset to 1 hr after sunrise.
         3. The neutral category D should also be used, regardless of wind speed, for overcast
           conditions during day or night and for any sky conditions during the hour preceding
           or following night as defined above.
       Source: From Pasquill (13).