
Page 348 - Fundamentals of Air Pollution 3E
P. 348
III. Estimating Concentrations from Point Sources 303
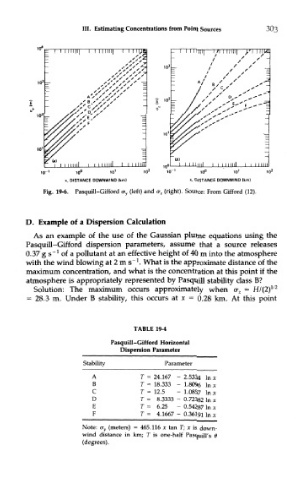
Fig. 19-6. Pasquill-Gifford <r y (left) and or z (right). Source: From Gifford (12).
D. Example of a Dispersion Calculation
As an example of the use of the Gaussian plume equations using the
Pasquill-Gifford dispersion parameters, assume that a source releases
1
0.37 g s" of a pollutant at an effective height of 40 m into the atmosphere
1
with the wind blowing at 2 m s" . What is the approximate distance of the
maximum concentration, and what is the concentration at this point if the
atmosphere is appropriately represented by Pasquill stability class B?
1/2
Solution: The maximum occurs approximately when a z = H/(2)
= 28.3 m. Under B stability, this occurs at x = 0.28 km. At this point
TABLE 19-4
Pasquill-Gifford Horizontal
Dispersion Parameter
Stability Parameter
A r = 24.167 - 2.5334 In x
B T* — 18.333 - 1.8096 In x
C ^T 1 12.5 - 1.0857 Inx
D T — 8.3333 - 0.72382 In x
E T — 6.25 - 0.54287 In x
F T = 4.1667 - 0.36191 In x
Note: <r y (meters) = 465.116 x tan T; x is down-
wind distance in km; T is one-half Pasquill's 0
(degrees).