Page 358 - Fundamentals of Air Pollution 3E
P. 358
V. Atmospheric Tracers                 313

        tity of a unique substance (the tracer), with measurements of that substance
        at one or more downwind sampling locations. Early experiments released
        uranine dye as a liquid spray; the water evaporated, leaving fine fluorescent
        particles to be sampled. Later, dry fluorescent particles (e.g., zinc-cadmium
        sulfide) having a relatively narrow range of particle sizes were used. Since
        the early 1970s, the gas sulfur hexafluoride has been used for most tracer
        studies, with collection in bags at sampling locations for later laboratory
        analysis using electron-capture gas chromatography.
          Tracer studies are generally conducted by going into the field for a 2-
        week to 1-month intensive study period. The tracer is released, generally
        from a constant height, continuously at a constant rate for a set period
        (perhaps 2-3 h) on a day selected for its meteorological conditions with the
        wind forecast to blow toward the sampling network. Sampling equipment is
        arranged at ground level on constant-distance arcs usually at three or four
        distances. The samplers begin at a set time as switched on by the field
        crew or by radio control. More sophisticated samplers allow the unattended
        collection sequentially of several samples. Sampling time varies from
        around 20 min to several hours. This procedure measures horizontal disper-
        sion at the height of the samplers.
          Although it is highly desirable to determine vertical dispersion as well
        by direct measurement, it is seldom practical. Sampling in the vertical can
        be done by sampling on fixed towers or arranging samplers along the cables
        of captive balloons. Both of these methods are extremely expensive in terms
        of both equipment and personnel. Although it is possible to sample the
        tracer with aircraft, the pass through the pollutant plume occurs at such
        high speed that it is difficult to relate this instantaneous sample to what
        would occur over a longer sampling time of from 20 min to 1 h.

        B. Computations
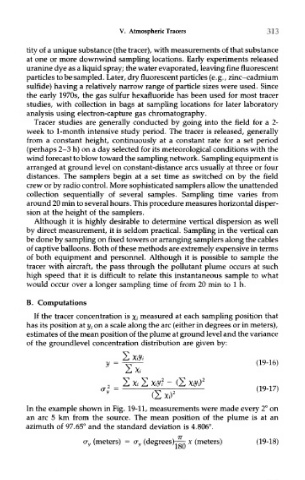
          If the tracer concentration is \i measured at each sampling position that
        has its position at y, on a scale along the arc (either in degrees or in meters),
        estimates of the mean position of the plume at ground level and the variance
        of the groundlevel concentration distribution are given by:


        In the example shown in Fig. 19-11, measurements were made every 2° on
        an arc 5 km from the source. The mean position of the plume is at an
        azimuth of 97.65° and the standard deviation is 4.806°.

