
Page 361 - Fundamentals of Air Pollution 3E
P. 361
316 19. Transport and Dispersion of Air Pollutants
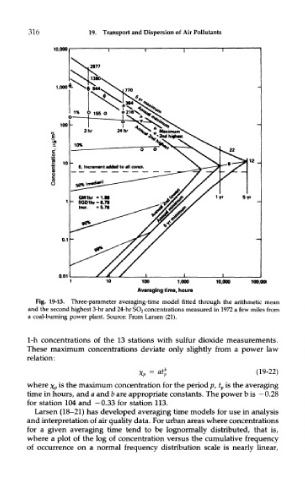
Fig. 19-13. Three-parameter averaging-time model fitted through the arithmetic mean
and the second highest 3-hr and 24-hr SO 2 concentrations measured in 1972 a few miles from
a coal-burning power plant. Source: From Larsen (21).
1-h concentrations of the 13 stations with sulfur dioxide measurements.
These maximum concentrations deviate only slightly from a power law
relation:
where x p is the maximum concentration for the period p, t p is the averaging
time in hours, and a and b are appropriate constants. The power b is — 0.28
for station 104 and -0.33 for station 113.
Larsen (18-21) has developed averaging time models for use in analysis
and interpretation of air quality data. For urban areas where concentrations
for a given averaging time tend to be lognormally distributed, that is,
where a plot of the log of concentration versus the cumulative frequency
of occurrence on a normal frequency distribution scale is nearly linear,