
Page 359 - Fundamentals of Air Pollution 3E
P. 359
314 19. Transport and Dispersion of Air Pollutants
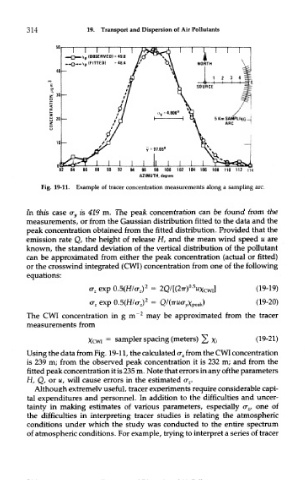
Fig. 19-11. Example of tracer concentration measurements along a sampling arc.
In this case cr y is 419 m. The peak concentration can be found from the
measurements, or from the Gaussian distribution fitted to the data and the
peak concentration obtained from the fitted distribution. Provided that the
emission rate Q, the height of release H, and the mean wind speed u are
known, the standard deviation of the vertical distribution of the pollutant
can be approximated from either the peak concentration (actual or fitted)
or the crosswind integrated (CWI) concentration from one of the following
equations:
2
The CWI concentration in g m may be approximated from the tracer
measurements from
Using the data from Fig. 19-11, the calculated <r z from the CWI concentration
is 239 m; from the observed peak concentration it is 232 m; and from the
fitted peak concentration it is 235 m. Note that errors in any of the parameters
H, Q, or M, will cause errors in the estimated cr z.
Although extremelv useful, tracer experiments require considerable capi-
tal expenditures and personnel. In addition to the difficulties and uncer-
tainty in making estimates of various parameters, especially cr zf one of
the difficulties in interpreting tracer studies is relating the atmospheric
conditions under which the study was conducted to the entire spectrum
of atmospheric conditions. For example, trying to interpret a series of tracer