Page 377 - Fundamentals of Air Pollution 3E
P. 377
332              20. Air Pollution Modeling and Prediction

         Approaches to long-term (monthly, seasonal, annual) regional exchanges
       are EURMAP (37) for Europe and ENAMAP (38) for eastern North America.
       These two models can calculate SO 2 and sulfate air concentrations as well
       as dry and wet deposition rates for these constituents. The geographic
       region of interest (for Europe, about 2100 km N-S by 2250 km E~W) is
        divided into an emissions grid having approximately 50 by 50 km resolution.
        Calculations are performed by releasing a 12-h average emission increment
        or "puff" from each cell of the grid and tracking the trajectories of each puff
       by 3-h time steps according to the 850-mb winds interpolated objectively for
        the puff position from upper-air data.
          Uniform mixing in the vertical to 1000 m and uniform concentrations
        across each puff as it expands with the square root of travel time are
                         1
        assumed. A 0.01 hr  transformation rate from SO 2 to sulfate and 0.029 and
               1
        0.007 h"  dry deposition rates for SO 2 and sulfate, respectively, are used.
        Wet deposition is dependent on the rainfall rate determined from the sur-
        face observation network every 6 h, with the rate assumed to be uniform
        over each 6-h period. Concentrations for each cell are determined by averag-
        ing the concentrations of each time step for the cell, and deposition is
        determined by totaling all depositions over the period.
          The EURMAP model has been useful in estimating the contribution to
        the concentrations and deposition on every European nation from every
        other European nation. Contributions of a nation to itself range as follows:
        SO 2 wet deposition, 25-91%; SO 2 dry deposition, 31-91%; sulfate wet depo-
        sition, 2-46%; sulfate dry deposition, 4-57%.
          In the application of the model to eastern North America, the mixing
        height is varied seasonally, and hourly precipitation data are used.

          V. MODEL PERFORMANCE, ACCURACY, AND UTILIZATION

       A. Methodology of Assessing Model Performance

         A number of statistics have been suggested (39,40) as measures of model
       performance. Different types of models and the use of models for different
       purposes may require different statistics to measure performance.
         In time series of measurements of air quality and estimates of atmospheric
       concentration made by a model, residuals d can be computed for each
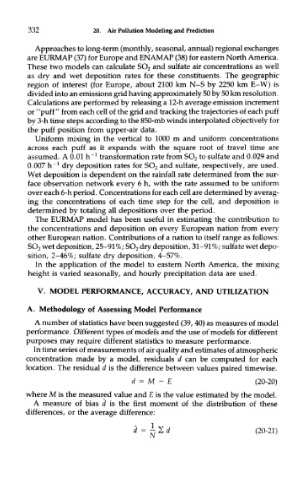
       location. The residual d is the difference between values paired timewise.


       where M is the measured value and £ is the value estimated by the model.
         A measure of bias d is the first moment of the distribution of these
       differences, or the average difference:

