
Page 382 - Fundamentals of Air Pollution 3E
P. 382
V. Model Performance, Accuracy, and Utilization 337
D. Performance of Photochemical Models
The performance of photochemical models is evaluated by their ability
to estimate the magnitude, time, and location of occurrence of the secondary
pollutant oxidant (ozone). Several photochemical models were evaluated
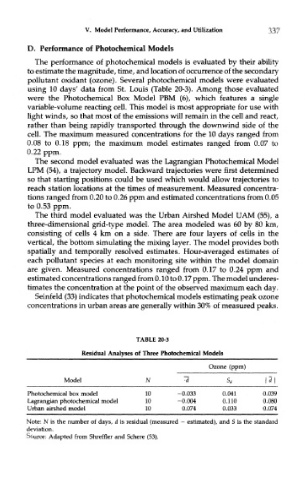
using 10 days' data from St. Louis (Table 20-3). Among those evaluated
were the Photochemical Box Model PBM (6), which features a single
variable-volume reacting cell. This model is most appropriate for use with
light winds, so that most of the emissions will remain in the cell and react,
rather than being rapidly transported through the downwind side of the
cell. The maximum measured concentrations for the 10 days ranged from
0.08 to 0.18 ppm; the maximum model estimates ranged from 0.07 to
0.22 ppm.
The second model evaluated was the Lagrangian Photochemical Model
LPM (54), a trajectory model. Backward trajectories were first determined
so that starting positions could be used which would allow trajectories to
reach station locations at the times of measurement. Measured concentra-
tions ranged from 0.20 to 0.26 ppm and estimated concentrations from 0.05
to 0.53 ppm.
The third model evaluated was the Urban Airshed Model UAM (55), a
three-dimensional grid-type model. The area modeled was 60 by 80 km,
consisting of cells 4 km on a side. There are four layers of cells in the
vertical, the bottom simulating the mixing layer. The model provides both
spatially and temporally resolved estimates. Hour-averaged estimates of
each pollutant species at each monitoring site within the model domain
are given. Measured concentrations ranged from 0.17 to 0.24 ppm and
estimated concentrations ranged from 0.10 to 0.17 ppm. The model underes-
timates the concentration at the point of the observed maximum each day.
Seinfeld (33) indicates that photochemical models estimating peak ozone
concentrations in urban areas are generally within 30% of measured peaks.
TABLE 20-3
Residual Analyses of Three Photochemical Models
Ozone (ppm)
Model N •d Si \d\
Photochemical box model 10 -0.033 0.041 0.039
Lagrangian photochemical model 10 -0.004 0.110 0.080
Urban airshed model 10 0.074 0.033 0.074
Note: N is the number of days, d is residual (measured - estimated), and S is the standard
deviation.
Source: Adapted from Shreffler and Schere (53).