
Page 381 - Fundamentals of Air Pollution 3E
P. 381
336 20. Air Pollution Modeling and Prediction
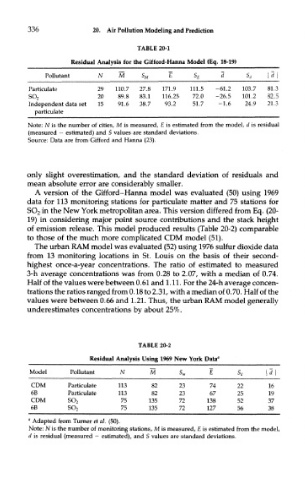
TABLE 20-1
Residual Analysis for the Gifford-Hanna Model (Eq. 18-19)
Pollutant N M SM E S E d S d d
Particulate 29 110.7 27.8 171.9 111.5 -61.2 103.7 81.3
SO 2 20 89.8 83.1 116.25 72.0 -26.5 101.2 82.5
Independent data set 15 91.6 38.7 93.2 51.7 -1.6 24.9 21.3
particulate
Note: N is the number of cities, M is measured, £ is estimated from the model, d is residual
(measured — estimated) and S values are standard deviations.
Source: Data are from Gifford and Hanna (23).
only slight overestimation, and the standard deviation of residuals and
mean absolute error are considerably smaller.
A version of the Gifford-Hanna model was evaluated (50) using 1969
data for 113 monitoring stations for particulate matter and 75 stations for
SO 2 in the New York metropolitan area. This version differed from Eq. (20-
19) in considering major point source contributions and the stack height
of emission release. This model produced results (Table 20-2) comparable
to those of the much more complicated COM model (51).
The urban RAM model was evaluated (52) using 1976 sulfur dioxide data
from 13 monitoring locations in St. Louis on the basis of their second-
highest once-a-year concentrations. The ratio of estimated to measured
3-h average concentrations was from 0.28 to 2.07, with a median of 0.74.
Half of the values were between 0.61 and 1.11. For the 24-h average concen-
trations the ratios ranged from 0.18 to 2.31, with a median of 0.70. Half of the
values were between 0.66 and 1.21. Thus, the urban RAM model generally
underestimates concentrations by about 25%.
TABLE 20-2
Residual Analysis Using 1969 New York Data"
Model Pollutant N M s m £ s d d
CDM Particulate 113 82 23 74 22 16
6B Particulate 113 82 23 67 25 19
CDM SO 2 75 135 72 138 52 37
6B SO 2 75 135 72 127 56 38
" Adapted from Turner et al. (50).
Note: N is the number of monitoring stations, M is measured, £ is estimated from the model,
d is residual (measured - estimated), and S values are standard deviations.