
Page 380 - Fundamentals of Air Pollution 3E
P. 380
V. Model Performance, Accuracy, and Utilization 335
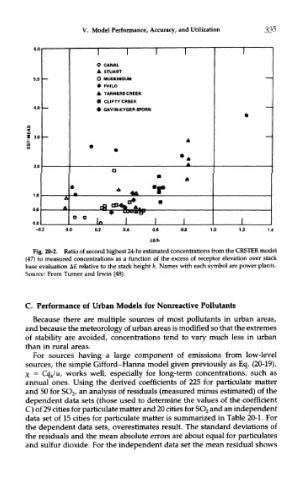
Fig. 20-2. Ratio of second highest 24-hr estimated concentrations from the CRSTER model
(47) to measured concentrations as a function of the excess of receptor elevation over stack
base evaluation AE relative to the stack height h. Names with each symbol are power plants.
Source: From Turner and Irwin (48).
C. Performance of Urban Models for Nonreactive Pollutants
Because there are multiple sources of most pollutants in urban areas,
and because the meteorology of urban areas is modified so that the extremes
of stability are avoided, concentrations tend to vary much less in urban
than in rural areas.
For sources having a large component of emissions from low-level
sources, the simple Gifford-Hanna model given previously as Eq. (20-19),
X - Cqju, works well, especially for long-term concentrations, such as
annual ones. Using the derived coefficients of 225 for particulate matter
and 50 for SO 2 , an analysis of residuals (measured minus estimated) of the
dependent data sets (those used to determine the values of the coefficient
C) of 29 cities for particulate matter and 20 cities for SO 2 and an independent
data set of 15 cities for particulate matter is summarized in Table 20-1. For
the dependent data sets, overestimates result. The standard deviations of
the residuals and the mean absolute errors are about equal for particulates
and sulfur dioxide. For the independent data set the mean residual shows